Campus-Occupancy
Marcos Buccat, Caliana Fortin and I had earlier in the semester begun the process of joining the HAAC2020 competition planning on doing the UH-Occupancy project. We all decided we did not have time to compete in the contest. A few weeks later the final project in our class started. We were a team again and we set out to complete the same project from the HAAC2020 contest as our final project.
Landing page
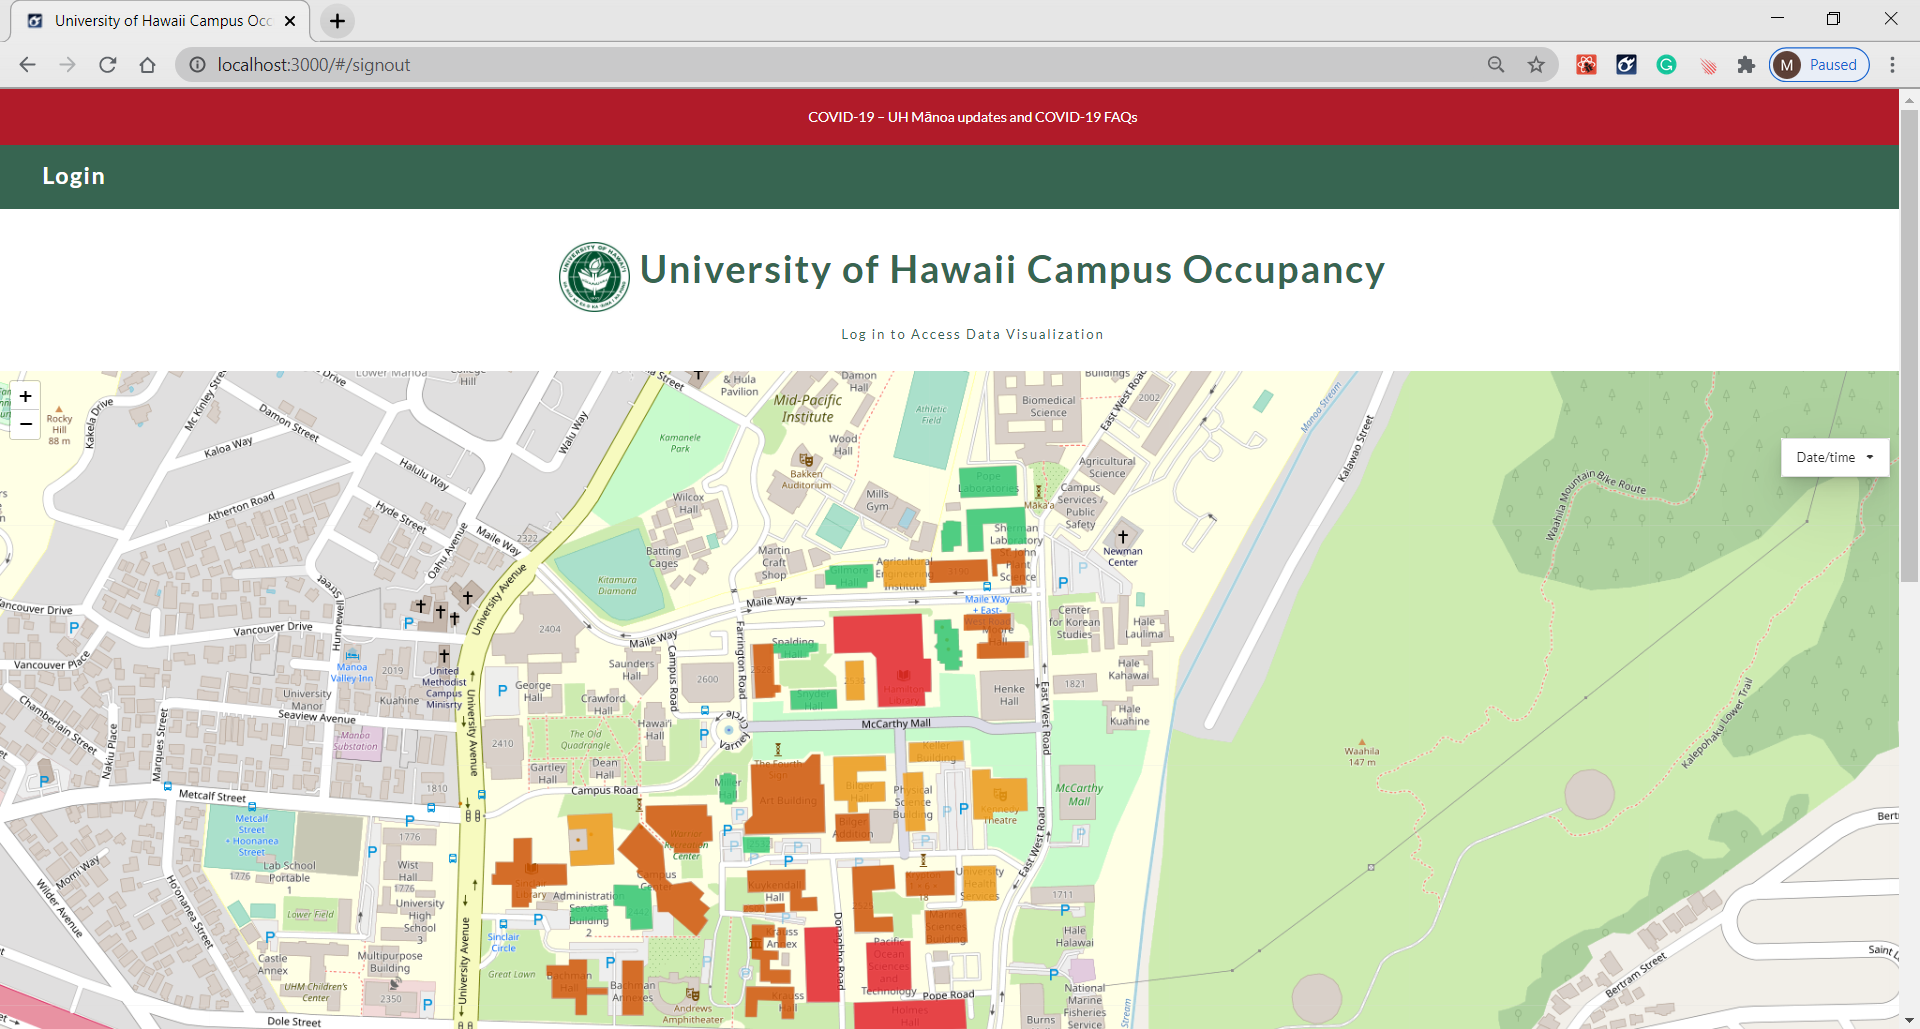
The application we built is a data visualization tool, that color-codes the buildings on the University of Hawaii at Manoa based upon their occupancy. The tool is intended for the campus administration to see how people are grouped during the day to make improvements due to the coronavirus social distancing guidelines. It uses data given to us by the university that shows how many devices are connected to wi-fi access points in three-hour increments.
The project was scheduled to take several weeks with three milestones. We used the Agile software development model along with Issue Driven Project Management as tools to help us finish and to experience some industry practices along the way. By the time we started this project we had become familiar with GitHub and were going to use that for tracking our issues. We used IntelliJ as our development environment and learned to implement GitHub CI into our code pushes. We set up automatic test configurations, and learned how to obtain a URL, and deployed the site to a web service. We made the site using a template that we had used in class already.
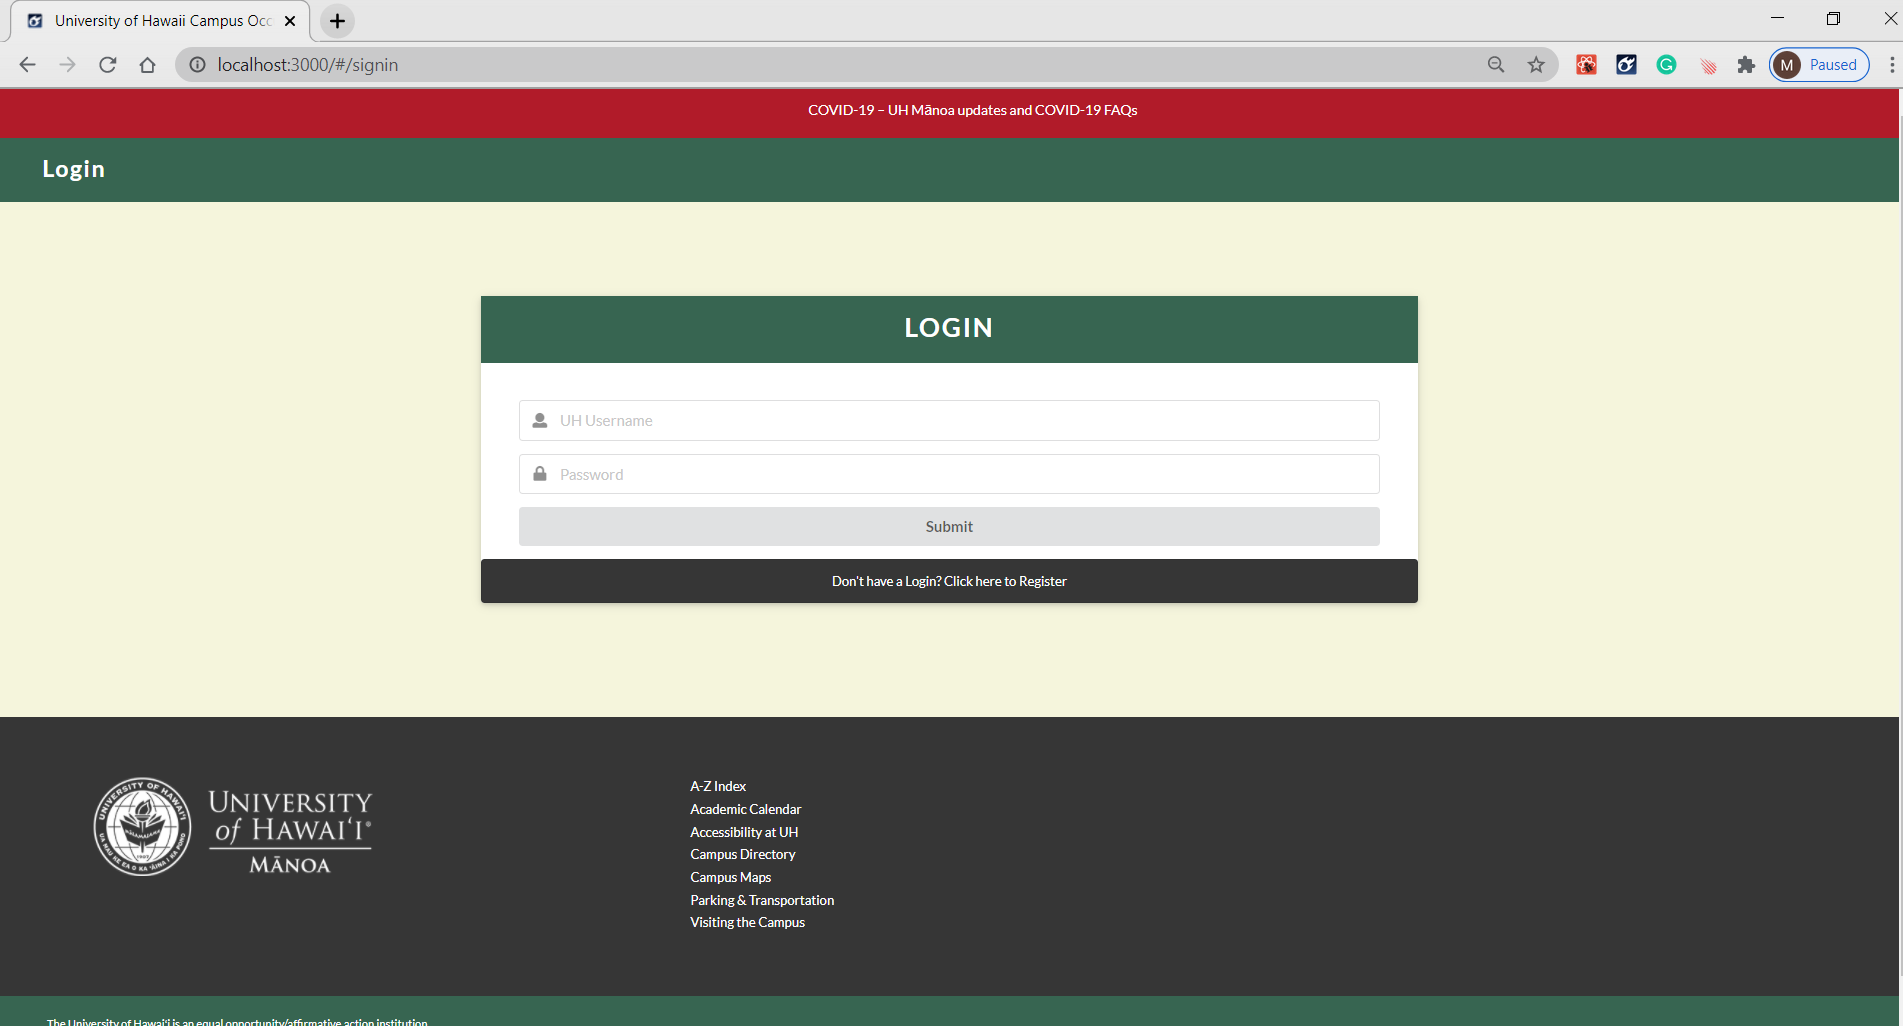
User Login page
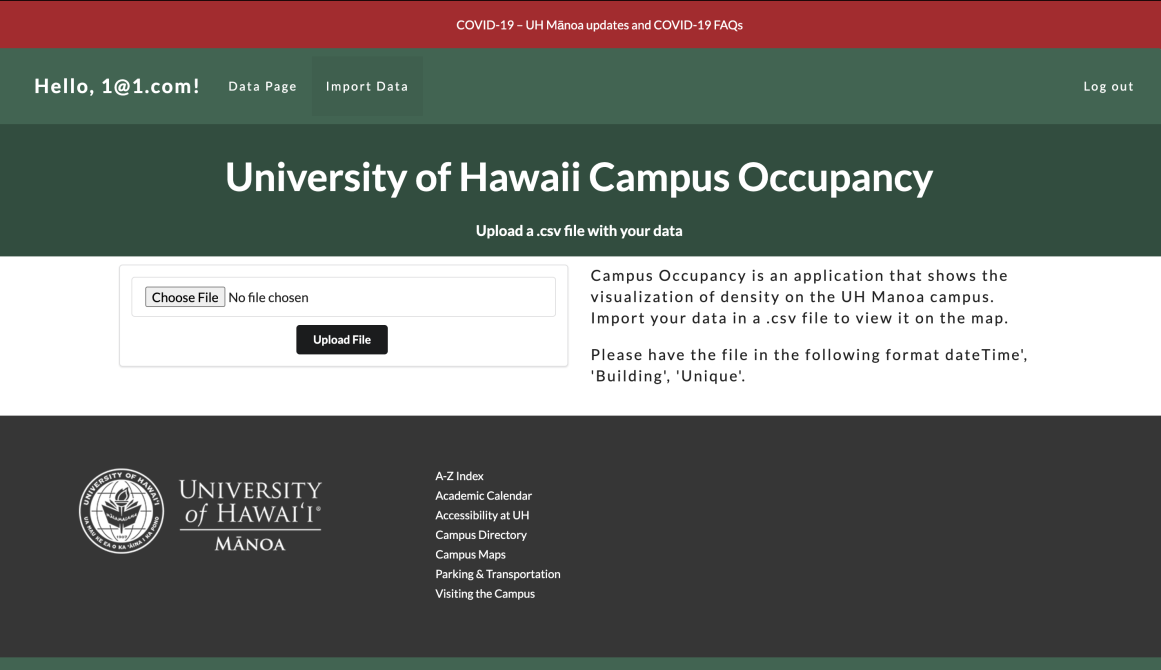
During this project there were a few issues that each of us worked on, for me the biggest learning experiences resulted from: 1) Writing the tests for the automatic testing that was implemented in the GitHub CI. 2) Learning how to deploy the site to the web, including the tools to check the status of the collections and data when it was deployed. 3) Figuring out how to turn 19,000 line JSON files into useful 600 line files.
As a group, we had to learn to communicate more as we progressed. It was challenging to have worked the whole semester remotely, never seeing my classmates and, then transitioning to teamwork. As a group, we collaborated a lot on the final JavaScript code to get the site to function. Getting the template and the JavaScript library Leaflet(our mapping resource) to work together was the final speedbump at the end.
Data upload page
Project links
You can visit the site here Campus-Occupancy. The GitHub project page is here Campus-Occupany. The GitHub code repo is here campus-occupancy.